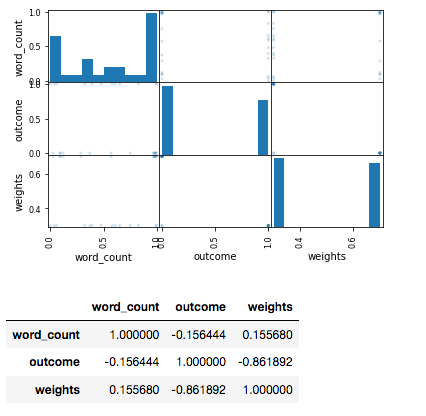
SPLOM Visualization SPLOMs, invented by John Hartigan in 1975, allow data aficionados to quickly realize any interesting correlations between parameters in the data set. Correlation Table In the broadest sense correlation is any statistical association, though in common usage it most often refers to how close two variables are to having a linear relationship with each other.
 ]
]